Compliments & Complaints Annual Report 2024 to 2025
3. Stage 1 Corporate complaints
The graph below shows the stage 1 corporate complaints by directorate. Corporate complaints include all complaints where there is no statutory process. Complaints concerning Children’s or Adult Social Care Services follow separate statutory procedures and are not included in these figures, however, we also receive complaints in relation to other services provided by those teams, for example Special Educational Needs and Disabilities (SEND) and Adults Strategy & Governance. During the review period, the Complaints and Improvements Team managed 2,259 stage 1 cases and processed 1,386 other “contacts” as enquiries or outside the complaints process.
Stage 1 Complaints by Directorate
|
Corporate Director Adults & Health (DASS) |
4 |
|---|---|
|
Corporate Director Children's Services (DCS) |
347 |
| Corporate Director Communities | 1,362 |
| Corporate Director P G & S | 339 |
| Corporate Director Resources | 176 |
| Deputy Chief Executive | 31 |
Total stage 1 complaints 2259
The graph illustrates the number of stage 1 complaints filed since Buckinghamshire Council was established.
Stage 1 Complaints Received
| Stage 1 Complaints | |
|---|---|
| 2020/2021 | 2,099 |
| 2021/2022 | 1,988 |
| 2022/2023 | 3,099 |
| 2023/24 | 2,199 |
| 2024/25 | 2,259 |
Complaints have seen a slight increase compared to the previous year but have not reached the peak seen in 2022/23 when there was a notable rise due to reorganisation of waste rounds. The number of complaints received each quarter remained stable (Q1 (514), Q2 (669), Q3 (521), and Q4 (555).) except during Q2 when there was an increase due to issues with the delivery of SEND transport.
Due to the universal nature of services delivered by the Communities directorate—such as highways and the 3.2 million scheduled bin collections carried out during the reporting period—this area received the highest number of complaints. This reflects both the scale of service delivery, and the higher levels of resident engagement typically associated with these essential, high-volume services. The number of complaints recorded represents a 4% increase compared to the previous year.
South Waste had the highest number of cases, (496) although this was a decrease of 15% from the previous year due to improved resolution efforts. Client Transport also experienced an increase in complaints, rising from 47 last year to 111, attributed to increased SEND transport issues. To note, however, during this period,7,700 eligible children received transport assistance from the Council, with 700 of them utilising personal transport budgets. Additionally, there were 253 non-eligible children traveling in a 'spare (paid-for) seat' on council-operated transport. This year Buckinghamshire Highways had 339 complaints, slightly down from 2023/4 (367).
Children's Services recorded 347 complaints, which is a 29% increase from last year and continues the previous upward trend. Of those 347 complaints, 244 were SEND service complaints - rising from 172 in 2024 an increase of 42%, mostly due to delays in processing Education, Health and Care (EHC) Needs Assessment requests. There is a high level of demand in this area and during this period, the Council received 1,782 requests for assessment, of which 784 were processed. Currently, there are 11,132 children receiving support for Special Educational Needs. SEND complaints now make up 70% of all Children’s Services complaints, up from 65% the previous year.
Delays in assessments, have been well documented as a national issue, caused in part by the shortage of Educational Psychologists, available to meet assessment demand within statutory deadlines. As of December 2024, Buckinghamshire maintained 7,059 Education, Health and Care Plans (EHCPs) a 51% increase since 2019.
The Planning, Growth & Sustainability directorate received 339 complaints a 6% increase from last year. About half of these (179) were related to Planning & Environment, particularly planning development and enforcement. During the reporting period the service received 10,845 planning (and related) applications. Housing complaints increased slightly to 146 compared to 133 in 2023/24, The Housing Service has experienced an increase in demand, with annual homelessness applications reaching 5,345 and Bucks Home Choice housing register peaking at 7,472 in February 2025. This figure coincided with the delivery of the Bucks Home Choice re-registration process, and as a result, there was an expected increase in customer engagement. The register subsequently reduced to 2,610 in March. The service remains committed to delivering a high standard of service.
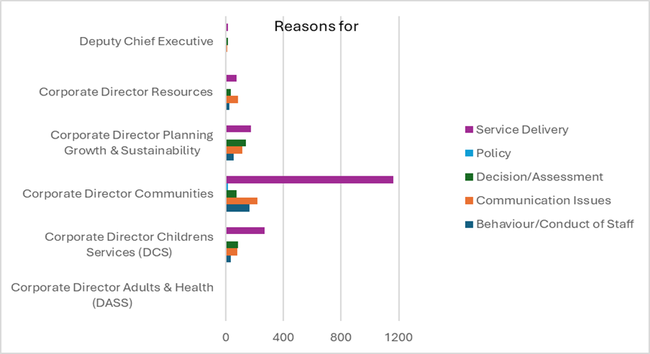
The below graph sets out the reasons for complaints by directorate. The most frequent cause of complaints is the quality of service provided, which has increased from 34% to 75%. This change may be due to improved categorisation of complaint causes. Each complaint classification has lower-level problem categories that provide additional context, enabling us to identify trends across different services and work with service to make improvements to their service delivery The second highest cause relates to communication issues, which has remained stable compared to the previous year at 17%. By categorising the problem, we can precisely identify the nature of the issue. For instance, we determine whether the concern was related to a lack of response, a delayed response, or dissatisfaction with the received response. This figure is 7% lower than prior years indicating an improvement in this area.